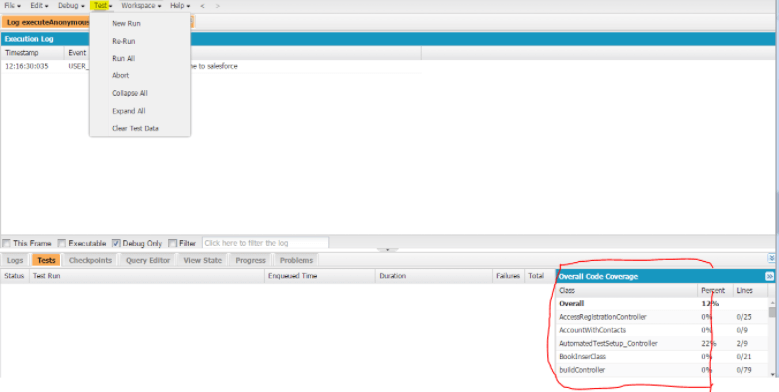
Executing Apex code in the developer console
Login to Salesforce and switch to classic and click Developer Console

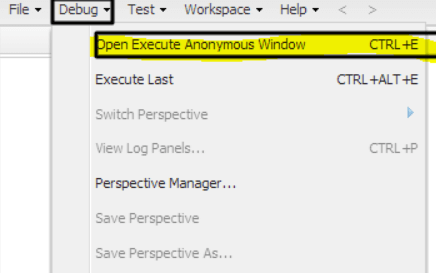
- Click to debug -> and click “Open Execute Anonymous Window” or Ctrl/E
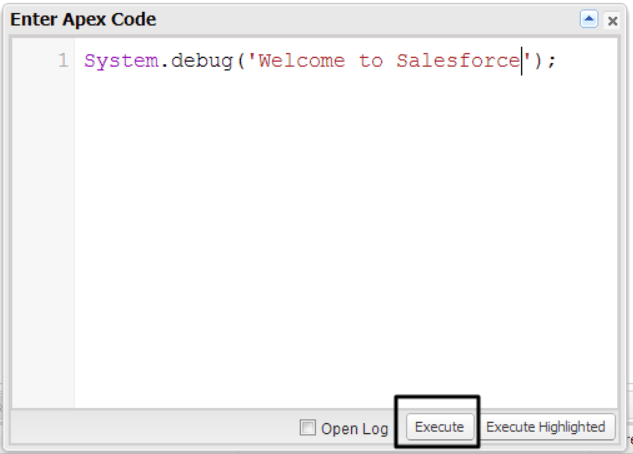
- Write code in the window and execute as following
- After executing the code log will be created every time and if you will click the log it will open the logs directly.

- To open logs double click on it also we can open multiple logs at the same time for result comparison
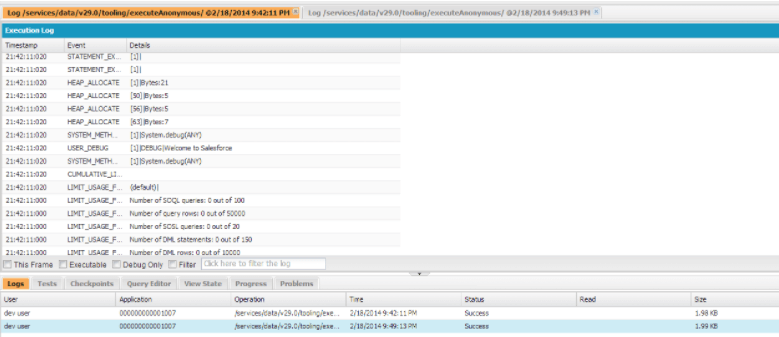
- View results in the console
After opening the log you will see a log that will contain lots of information and you will find some checkboxes under an opened log that will help to filter the logs.
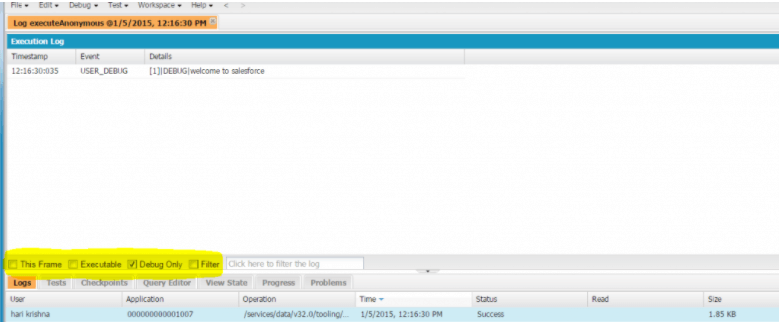
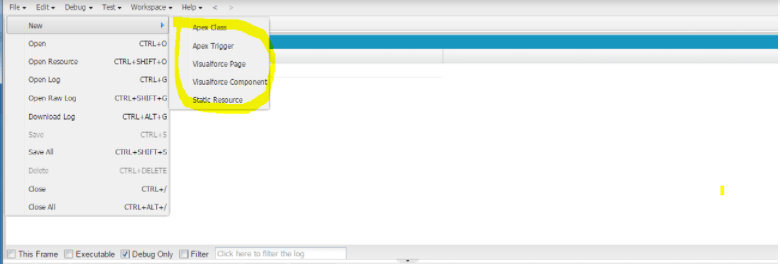
In the above screen, I only selected the debug log check box, So it will display debug log statements. Also by clicking on other checkboxes, you can differentiate log results. - By using Developer Console we can also create/open classes, triggers, pages, and static resources.
- Also we can see code coverage of classes & triggers and run test classes, clear test data and run abort test class execution.
