Every developer/designer should be aware of some developer tools and extensions available in the chrome browser.
Chrome developer tools provide deep visibility into the web pages. We can check layout, performance loading issues and also debug Javascript issues with breakpoints.
Accessing the DevTools :
Select the Chrome menu at the top-right of your browser window, then select Tools > Developer Tools or we can use shortcut ctrl+shift+i or press F12 key. We can also open Dev tool by Right-click on any page element and select Inspect Element.
Chrome has 8 main group of tools available :

1. Element panel : In the element tool we can view or edit DOM (HTML) and can edit styles of the corresponding html element.
2. Network panel : Network tool is used to debug page load performance issues. We can check time being taken for loading resources (like css file, image urls, Js file) to identify slow components :

3. Sources Panel : Sources tab loads all the Javascript files included in the current page. In this panel we can debug the Javascript using breakpoints. This feature is excellent for Javascript developers to debug their scripts.
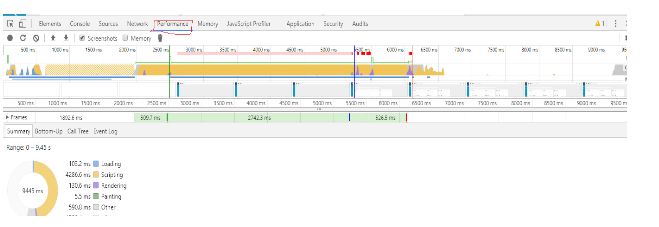
4. Performance / Timeline : Performance/timeline panel gives us overview of where time is spent when loading a page.This panel is used to analyze all the activity in our webpage when it loads. This is the best tool to investigating performance issues in our application.

5. Profile panel : Profile tab shows us memory and cpu consumption. It displays the execution time and memory usage of web application. It includes two profiles:
1) CPU Profiler : It shows where execution time is spent in our page’s JavaScript functions
2) Heap profiler : It displays memory distribution according to page’s JavaScript objects and DOM
CSS Selector Profiler records the aggregate time spent matching selectors to elements in the DOM tree.
6. Resources/Application Panel : This panel inspects all the resources that are loaded in the current page. Like : Web SQL databases, Local Storage, Cookies, AppCache, images, font etc.
7. Audit panel : Audit panel is use for checking the common accessibility problems and it generates an API for running these rules in an HTML page. It also provides suggestions and optimization for decreasing page load time.
8. Console panel : In the console tool we can play with the Javascript. It displays Log information like output of console.log(“message”), console.info(), console.error() etc. In the console prompt we can execute temporary Javascript as well to apply on the loaded html elements for experimentation or to test the working of a script. If it works then we can add this code to permanent code files for example.
Useful extensions in chrome :
Awesome screenshot : This extension is very useful. It not only takes screenshot but also allow us to highlight the area and write our comments on image. We can select local image from our machine as well to edit in this plugin. It lets us record out screen interaction as a video as well.
ColorZilla : ColorZilla is very useful extension. We can get color code for any color on the loaded page or from its own color picker. It also allow us to generate the gradient color and use that gradient in our css code.
Window Resize tool : Chrome provides lots of window resize extensions. If we want to test our website for different screen size then we can use this extension.
