Performance testing is used to determine that the web application under test will satisfy high load. Apache Jmeter can be used to analyze overall server machine performance under heavy load.
Apache Jmeter Performance test includes:
* Load Test
* Stress Test
Creating a Performance Test Plan in Jmeter
We are going to check performance analysis on http://webnersolutions.com/ with 500 users hitting the server.
Before testing the performance of website, we will determine the:
1. Normal Load: Average number of users that visit the website at the same time (in this we can take 100 as user count for example)
2. Heavy Load: The maximum number of users that visit your website at the same time (it is up to you to decide on this)
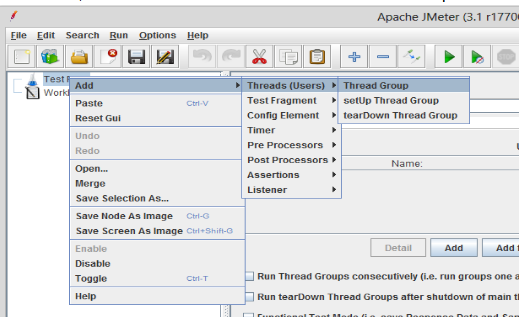
Step 1: Add Thread Group
1. Start Jmeter, Select Test Plan on the tree and Add Thread Group.
2. In Thread Group control panel, enter Thread Properties as in below image.
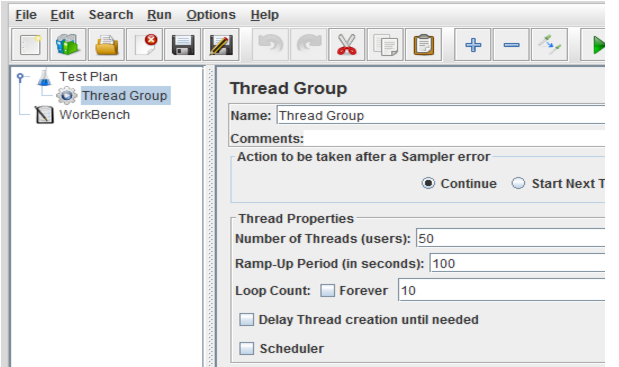
In Above image we have Number of Threads, Loop Count and Ramp-Up Period
Number of Threads: 50 users connect to the target website
Loop Count: 10 iterations to add more users incrementally and test
Ramp-Up Period: 100 (it is for the delay time before adding more users) and delay time equals to no of users divided by ramp up period for example 50/100 = 0.5 seconds.
We have no of threads 50 and loop count 10 which means 1 user connecting to target website 10 times so 50 * 10 = 500 users.
Step 2: Jmeter Elements
For test we require the following elements:
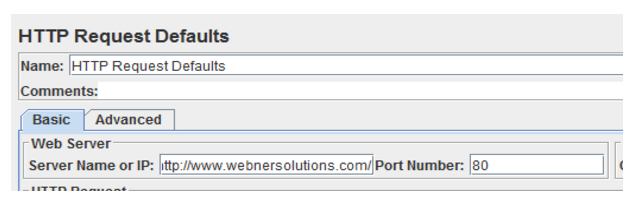
HTTP request Default: Right-click on Thread Group and select: Add → Config Element → HTTP Request Defaults.
In this request you have to enter the website name on which you want to run test.
HTTP Request: Right-click on Thread Group and select: Add -> Sampler -> HTTP Request.
In this request you can enter the selective path of the website that you want to test.
For example if I want to test the specific page in the http://webnersolutions.com/ like http://webnersolutions.com/contact-us/ then the test only run on this specific page.
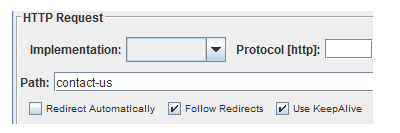
If you want to test the whole web application then just left the path field blank.
Step 4: Graph Results
Graph results are used to view the detailed results of test. Just Right click Test Plan and Add → Listener → Graph Results.
Step 5: Run the test
Now Save and Run the test by pressing (Ctrl + R).
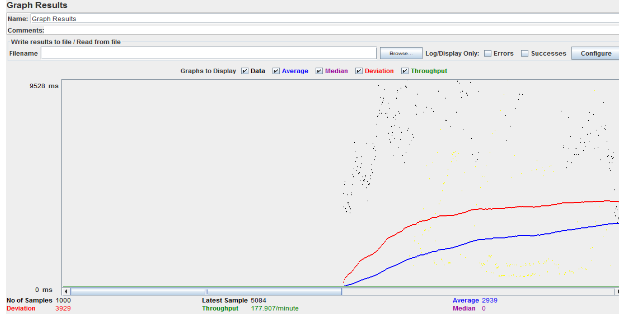
Above are the results of the test.
In this result we have 4 main factors Deviation, Throughput, No of Samples, Average.
Black: The total number of current samples sent.
Blue: The current average of all samples sent.
Red: The current standard deviation.
Green: Throughput rate that represents the number of requests per minute the server handled
To analyze the performance of the web server under test, you should focus on 2 parameters.
1. Throughput
2. Deviation
Throughput:This parameter represents the ability of the server to handle heavy load. The higher the Throughput is, the better is the server performance.
In this test, the throughput of Webner server is 177.907/minute. That means webner server can handles 177.907 hits every minute.
Deviation: This parameter indicates the deviation from the average which means smaller the value, better is the performance.