Dashboards in Salesforce are the graphical representation and easily understandable visual presentation of reports data in salesforce. Salesforce dashboards have some visual representation components like graphs, visualforce pages, charts, tables, gauges, and metrics. Salesforce dashboard components are used to represent data. One can use up to 20 components in a single dashboard to represent different reports of Salesforce data.
Reports and Dashboards in salesforce are the analytics tools that allow all the users in an organization to manage the data in the form of reports and visual representation of data. Through reports and Dashboards in the salesforce sales team can produce reports of the sales pipeline, the marketing team can produce reports on the progress of campaigns and users can also create custom reports in salesforce.
To utilize Salesforce dashboards in an efficient way it’s very important for one that he should be aware of the Lightning Report Builder. First of all, you must know that the reports you create through the Lightning Report builder are known as source reports. Each source report provides data for your components that are added to the Salesforce dashboard. Different components can have different source reports. However, each component can only have one source.
Creating Dashboards in Salesforce Lightning
To create or edit a Salesforce Dashboard, navigate to the Dashboards tab, click New Dashboard to create, or click on an existing dashboard to edit.
While building a new dashboard, firstly name it, and add a description if you’d like to, and select the right folder for proper organization.
Make sure to store the reports in folders that the intended dashboard viewers can access. Otherwise, they will not be able to see the results in the component that are added to the Salesforce dashboard.
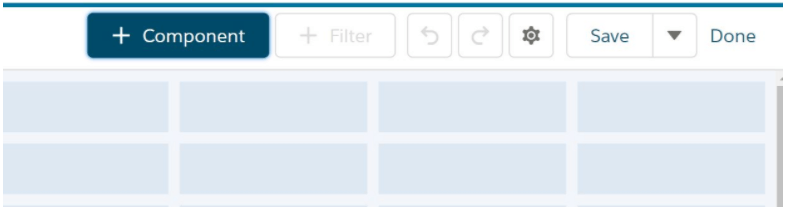
Press the “+” Component icon to add a component to the dashboard.
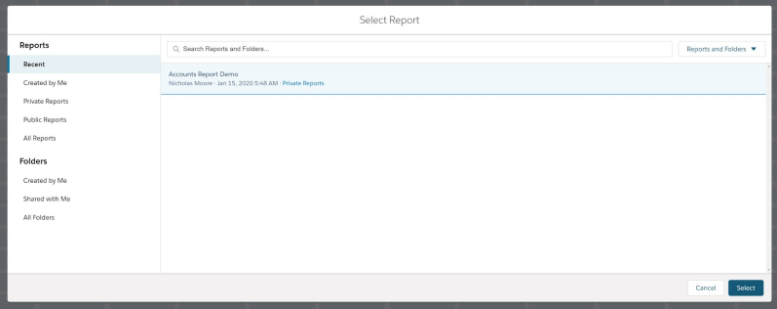
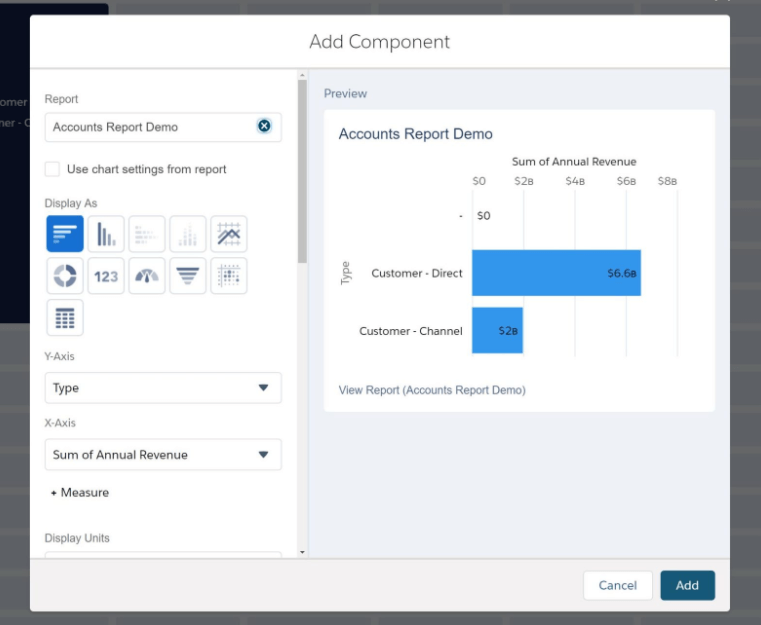
Then Choose a source report for the component, then press Select. Customize how the component displays data, and then press Add.
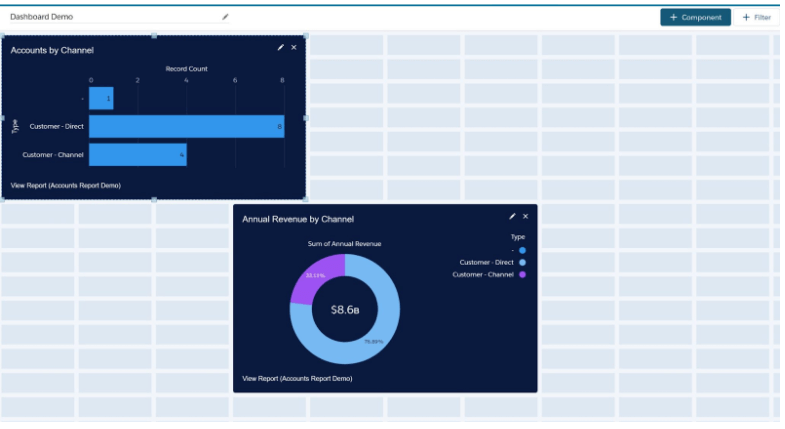
You can also arrange or resize the component as you like within the edit grid. Press the cross “x” on the component to remove a component.
Press the “+” Filter to add a filter to the dashboard.
To filter all the dashboard’s components the drop-down fields can be used. After that, give the filter a Display Name for easy identification. After that, simply assign values to the filter by clicking Add Filter Value.
Dynamic Dashboards
Dynamic dashboards are the dashboards in which the user is able to see the dashboard based on their access level. If you prefer not to have too much access, dynamic dashboards are your go-to choice. Whoever is specified above the dashboard next to “Viewing as” is able to view the dashboard as a specified user.
“Viewing as” options:
- Me – Dashboard readers seeing data in the dashboard according to his/her access to data.
- Another person – Dashboard readers see data in the dashboard according to the data access level of the person whom you specify as the viewer.
- Dashboard viewer – Dashboard readers see data as themselves i.e data is shown according to their own access to the data.
An org can have up to five dynamic dashboards for Enterprise Edition, ten for Unlimited and Performance Edition, and three for Developer Edition. Dynamic dashboards are not available in other editions. Additional dynamic dashboards may be available for purchase.
Dynamic Dashboard Limitations
- Following a component is not supported
- Cannot be saved in private folders
- Refreshes can’t be scheduled. Dynamic Dashboards must be refreshed manually.