Data Analysis Expressions (DAX) is a powerful formula and query language used in Microsoft Power BI, Excel Power Pivot, and Analysis Services to perform calculations and manipulate data. It allows users to create custom metrics, measures, and calculated columns, enabling deeper analysis and insights into their data.
Here’s an overview of DAX and its usage with functions:
1. Formula Language: DAX is a formula language that allows users to define expressions for calculating and manipulating data. It is similar to Excel formulas but is optimized for working with relational data models.
2. Functions: DAX includes a wide range of functions that users can use to perform calculations, apply filters, manipulate strings, and work with dates and times. These functions can be categorized into several groups:
- Math and Trigonometry: Functions like SUM, AVERAGE, MIN, MAX, and ROUND are used to perform basic mathematical operations on numerical data.
- Logical: Functions like IF, AND, OR, and NOT are used to apply conditional logic and make decisions based on certain criteria.
- Text: Functions like CONCATENATE, LEFT, RIGHT, and LEN are used to manipulate text strings and perform operations like concatenation and extraction.
- Date and Time: Functions like YEAR, MONTH, DAY, TODAY, and CALENDAR are used to work with date and time values, perform date calculations, and create calendar tables.
- Filtering: Functions like FILTER, ALL, ALLEXCEPT, and VALUES are used to apply filters to data and modify the filter context within calculations.
- Statistical: Functions like MEDIAN, VAR, STDEV, and RANKX are used to perform statistical calculations and analyze data distributions.
- Aggregate: Functions like SUMX, AVERAGEX, and COUNTX are used to perform calculations over sets of data, typically within iterations or loops.
- Relationship: Functions like RELATED, RELATEDTABLE, and LOOKUPVALUE are used to navigate relationships between tables and retrieve related data.
3. Usage: DAX expressions can be used in various contexts within Power BI, including:
- Measures: Measures are calculations that aggregate data within a Power BI report. They are typically used in visualizations to display summarized information, such as sales totals, average prices, or customer counts.
- Calculated Columns: Calculated columns are columns that are added to a data table by applying DAX expressions to existing columns. These calculated columns become part of the data model and can be used for filtering, sorting, and grouping data.
- Row-Level Security (RLS): DAX expressions can also be used to define row-level security rules, restricting access to certain rows of data based on user permissions and roles.
- Query Editor: DAX expressions can be used in the Query Editor to create custom columns, filter rows, and transform data before loading it into the data model.
Overall, DAX is a powerful language that empowers users to perform complex calculations and analysis on their data within Power BI and other Microsoft products. With its extensive library of functions and flexible syntax, DAX enables users to create insightful reports and make data-driven decisions.
Example:-
Suppose you have a dataset containing information about sales transactions, including the date of the transaction, the product sold, the quantity sold, and the revenue generated. You want to analyze this data and create a report that shows the total revenue generated per month.
To do this, you’ll need to use DAX to create a measure that calculates the total revenue for each month. Here’s how you can do it step by step:
- Load your data into Power BI: Start by importing your dataset into Power BI.
- Create a Date Table (Optional): If your dataset doesn’t already have a date table, you can create one using the “Enter Data” option in Power BI or by importing a calendar table from an external source.
- Define a Measure: In Power BI, go to the “Modeling” tab and click on “New Measure”. This will open the formula bar where you can enter your DAX expression.
- Write the DAX Expression: Use the SUMX function to iterate over each row in your dataset, calculate the revenue for that row (quantity * unit price), and then sum up the results to get the total revenue for the month. You’ll also need to use the CALENDAR and FILTER functions to create a filter context that groups the revenue by month.
The DAX expression would look something like this:
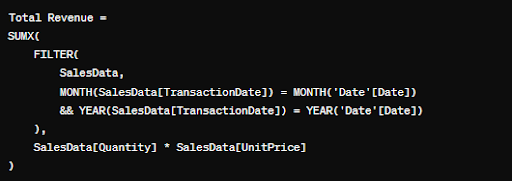
In this expression:
– SalesData is the name of your sales transaction table.
– TransactionDate is the column in your sales data table that contains the date of the transaction.
– Date is the name of your date table.
– MONTH and YEAR functions extract the month and year from the transaction date.
– FILTER function applies a filter to the sales data table to include only the rows where the transaction date matches the date in the date table.
– SUMX function iterates over each filtered row, calculates the revenue for that row, and then sums up the results.
- Add the Measure to Your Report: Once you’ve defined the measure, you can add it to your report canvas alongside a visual that displays the revenue by month, such as a line chart or a bar chart.
- View the Results: Power BI will automatically calculate the total revenue for each month based on the DAX measure you’ve created, allowing you to analyze trends and patterns over time.
By using DAX, you can perform complex calculations and analysis on your data within Power BI, allowing you to derive valuable insights and make informed business decisions.